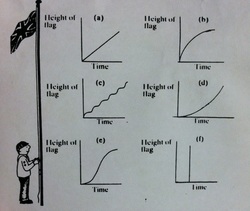
In this image, it shows graphs depicting a flag being raised; with the height of the flag on the y-axis and time on the x-axis. The task is to examine all of the graphs and see if it makes sense that they represent a flag being hoisted up a flag pole.
- In the first graph,the line says that the flag was hoisted at a steady rate until it reached the top.
- The next graph shows that the flag was quickly raised up the pole; but as it neared the top, the process slowed down.
- In the second row, the first graph says that the flag was raised in short bursts and the speed of it being raised changed a lot.
- Next is a line that says that the person hoisting the flag started out slow and increased the speed as the flag went up the pole.
- The graph in the third row shows a line that means the flag started out being raised at a slow pace, then increase in height quickly, and plateaus towards the top.
- Lastly, the line is undefined, meaning that the flag would have to be raise all the way to the top in the same moment; Which would be impossible.
